Most of the time, in any industrial process in which raw materials are subjected to processes aimed at their transformation to obtain finished products, a series of questions that engineers will want to answer and / or communicate will arise, for example:
- What are the raw materials fed to the process, their compositions, and quantities?
- What are the finished products, their quality and quantity?
- What intermediate processes are necessary for their transformation and processing?
- What intermediate products are generated, their quantity and what are their physical and chemical properties.
- Given a change on the specifications of feeding or products, what impact will these modifications have on the processes?
The more complex the processes, the more necessary it is to have tools that allow the transmission of all this information in a simple and simplified way. Engineers use different documents as a mean of transmitting information, more specifically, process engineers have developed a set of drawings that allow us to answer all these questions, these family of drawings are called Process Diagrams.
There are no standardized procedures for their preparation, but taking into account their final use, these can be divided into three large groups:
- Process Block Flow Diagrams (BFD).
- Process Flow Diagrams (PFD).
- Piping and Instruments Diagrams (P&IDs).
Regardless of their designation, what differentiates them is the information that each one of these documents can provide during the project’s life cycle, which goes from visualization through implementation to operation phase.
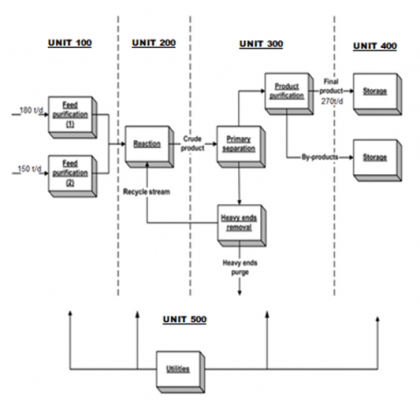
In this way for example, a BFD is a type of diagram that groups the equipment into units, showing them all as a single block and presenting relationships between each of these units, the flows that are exchanged between them and how they change throughout the process, both in quantity and quality. It is a very simple diagram that can condense an entire process into just one sheet. This can be very useful for tracking all streams throughout the units.

Process Block Flow Diagram
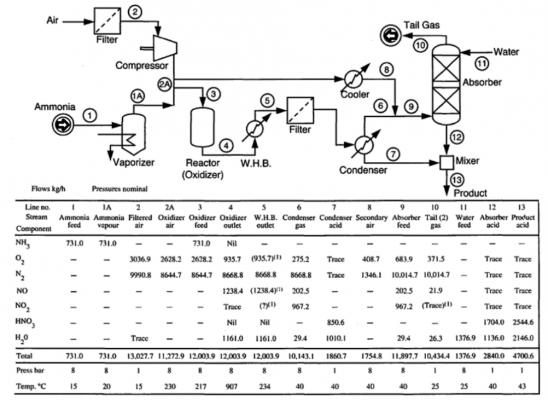
Another type of process diagrams are Process Flow Diagrams, which are the precursors of the Piping and Instrumentation Diagrams. In these, the units are displayed showing the equipment that make up each one of them, but without too much detail, like parallel equipment, secondary equipment or detailed instrumentation and control. Only the main equipment and the most important control loops are shown. In addition, these diagrams collect the streams that connect them, identified with individual numbers, which allow each of these streams to be displayed in a table with all the information on flow rates, operating conditions, composition, and physicochemical properties. It is a document clearly created and managed by process engineers fundamentally for equipment design.
Sometimes the process flow diagram is the diagram itself, generated by the process simulation.

Process Flow Diagrams
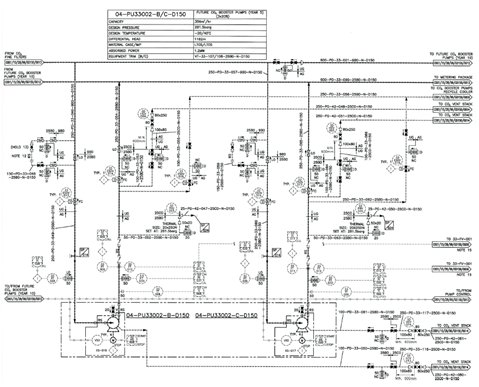
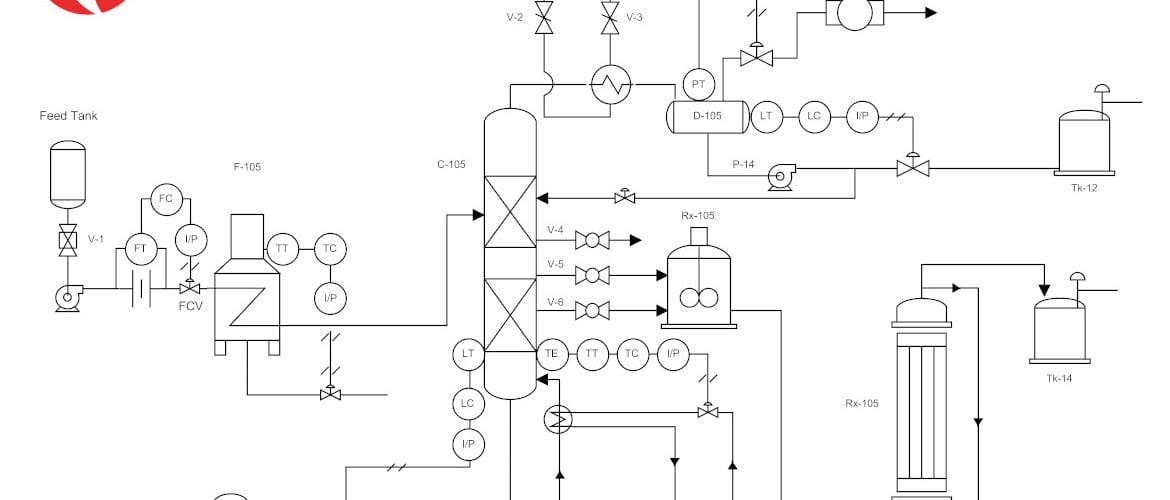
Finally, we have Piping and Instrumentation Diagrams or P&ID. These are a detailed representation of the entire process, showing either main and auxiliary equipment, all pipes with their accessories, sizes, material specifications, as well as all the control and safety instrumentation, valves, alarms, drains and purges. They also usually include notes that allow the understanding of special operating conditions or differences from the normal plant operation. Some regulatory agencies often require their use during design and construction, as well as during operations.
The standard of symbols used in these diagrams are generally based on the ANSI / ISA-S5.1 Identification and Instrumentation Symbols of the International Society for Automation. Technological advances have transformed them into intelligent documents, capable of storing a large amount of digital information.

Piping and Instruments Diagram
It is important to understand and use symbols that clearly identify the equipment, instruments and items in the actions that appear in the P&IDs. With their digitization in specialized programs, they have become a resource for storing information with great detail of each of the elements that make up the plant.
If you want to know more:


 WhatsApp