
Control Valve definition
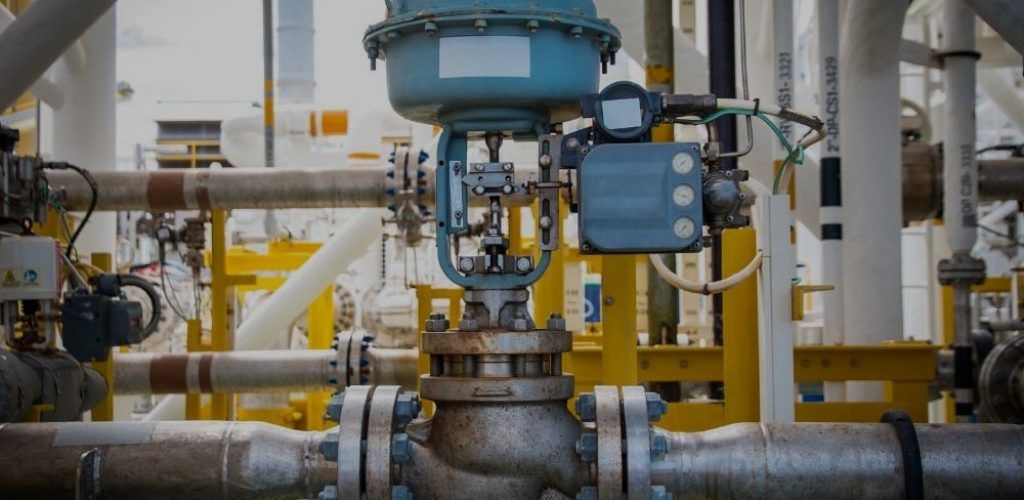
It’s very common to have a control valve as the final control element in industrial process plants. Depending on its function, the valve must control flow, temperature, pressure, level, or concentration.
Considering that the control loop (composed of the measurement element, the control valve, and the controller) must control the process, this means that the process operates stably and it must behave according to the design, the control valve it shall be designed so that it can work within the entire operating range requested by the process. To do this, the process engineer must provide the operating limit values (min, normal and maximum) where the control valve shall be designed through the process datasheet.
To determine the limit design data the valve sizing coefficient, that was introduced by Masoneilan in 1944, is commonly used and is defined considering the following formula:
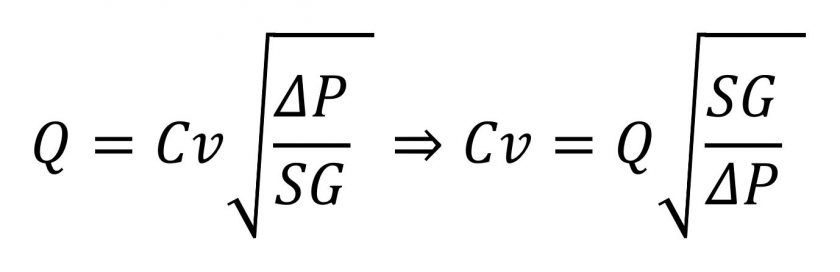
Where the dimensioning coefficient (Cv) is a function of the flow rate (Q), the specific gravity (SG), and the valve pressure drop DP.
Analyzing the previous equation to determine the minimum valve Cv (which will correspond approximately to 10% of its opening), the matching process data should be used when: the flow is minimum, the lowest value of the specific gravity (normally at the highest coincident temperature) for the operation case at minimum flow rate and the highest pressure drop:
Cv min:
- Qmin
- SGmin
- ΔP max
If there were other operating cases that could be evaluated, with the lowest specific gravity value in the process (with its coincident flow rate and pressure drop) it should also be evaluated for CV min.
Process variables are coincident when there is a possibility that these variables may be present simultaneously within an operating case. For example: 22 m3/h of water is pumped at 5º C at 5 bar and a density of 1000 kg/m3. The process data in the matching pump impulsion would be:
- Temperature: 5ºC
- Pressure: 5 bar
- Flowrate: 22 m3/h
- Density: 1000 kg/m3
For the valve Cv maximum calculation (which will correspond approximately to 85% of its opening) it will be applied the same procedure, the matching process data should be used when: the flow is maximum, the highest value of the specific gravity (normally at the lowest coincident temperature) for the operation case at maximum flow rate and the lowest pressure drop:
Cv max:
- Qmax
- SGmax
- ΔP min
As the Cv min, if other operating case cases could be evaluated, with the highest specific gravity value in the process (with its coincident flow rate and pressure drop) it should also be evaluated for CV max. The same consideration could be done for the operating case where the pressure drop is minimum.
Once the operating cases where the minimum and maximum Cvs are obtained, the coincident values for usual operation cases will be also reported. . Usual operation case data are coincident operation values where the valve operates most of the time. During normal operation, the valve will operate with a value of Cv within the Cv limit values obtained previously.
In the following figure:
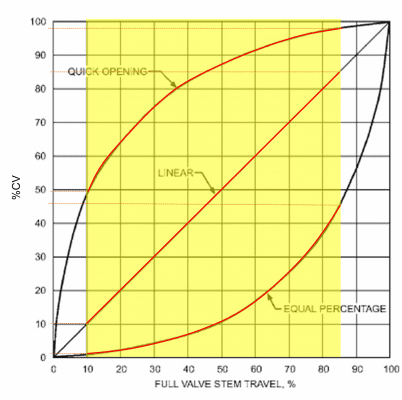
The different Cv (in this case expressed as %Cv) can be observed depending on the type of valve. . That’s why is very important to correctly define the limits of process data that define the control valve. Once the limits are defined, it will be assured that the control valve will operate according to the process design.
Additionally, It can be shown in the figure the rangeability (different regulable flowrates which are proportional to the Cv) that exists between the different kinds of valves. The I&C engineer with the process data, following the I&C specifications department and project instructions, selects the control valve type with the Control valves vendors. Then, the Engineering department validates if the selected control valve is technically valid from the process point of view.
If you want to know more:
Ingeniería de Procesos en Plantas Industriales