Piping and Instrumentation Diagrams (P&ID)
- Posted by: Mónica Portillo
- Category: Process Engineering

Piping and instrumentation diagrams (P&ID) are a schematic representation of the piping process with mechanical details of equipment, instruments, piping, valves, and control loops, all necessary to ensure safe operation of the facility. In other words, they are plans that, in addition to showing the sequence of operations of the Process Flow Diagram (PFD), show all the equipment and requirements for pipes, valves and accessories; all control systems and instrumentation required for the operation of the plant; and all required safety devices (safety valves, rupture discs, flare), etc.
For the development of the P&ID, the PFDs must already be prepared and approved. These diagrams must show:
1. The identification of all process lines.
2. The process equipment, design and operating conditions of this equipment, accessories, valves, instruments, and their adjustment points (set point).
3. The graphic representation of what is described in the philosophy of operation and basic control of the process, as well as the instrumented safety systems.
The graphic symbols to be used for the preparation of instrumentation diagrams and plans can be established using the ANSI/ISA 5 standard. This standard establishes a uniform means to represent and identify instruments or devices and their inherent functions, instrumentation systems and functions, and application software functions used for measurement, monitoring and control, by presenting a designation system that includes identification schemes and graphic symbols.
These plans are generated by the Processes and Mechanics Discipline; however, the Instrumentation Engineer can participate in their realization. They are controlled documents formally issued at various stages of the project.

Figure No. 1 Example of a P&ID
What are Piping and Instrumentation Diagrams (P&ID) used for?
They are used:
• To plan and develop the documents for the procurement of equipment and piping required during construction.
• To understand the operation of the process as a graphic description.
• To develop operational, maintenance and Integrated Change Control procedures.
• As input for mechanical disciplines, instrumentation, and safety.
• For risk studies (HAZOP, SIS/SIL) of the plant.
• As a controlled document formally issued at various stages of the project.
How to create a Piping and Instrumentation Diagram (P&ID)?
The following steps should be followed to create a P&ID diagram with the help of a computer-aided design program, developed by drafters and reviewed by qualified personnel who are familiar with the plant process.
• Create the complete list of instruments and equipment needed for the process.
• Check the symbols used for each piece of equipment.
• Organize all the equipment in the order of the process and make the connections.
• Review all the details carefully.
• Go through the process several times and look for flaws.
• Have it reviewed by the supervisory line of discipline.
• Present and discuss with the client or custodian of the plant for the validation of the revisions and final issuance.
There are different programs available to create or draw a P&ID diagram; each one of them has its own functionalities and characteristics, such as:
• SmartPlant (P&ID)
This is a software based on engineering rules and international standards for the creation of: Process Flow Diagrams (PFD), Piping and Instrumentation Diagrams (P&ID), lists of lines, and lists of equipment.
Using a set of industry-standard piping and instrumentation symbols that were designed to meet ISO standards, it works in an integrated manner with the disciplines of engineering, procurement, and construction by applying a rules-based and validation philosophy that enables the design development created in a project database. This database allows the personalization of the company’s work processes and the management of changes, which are very important for traceability in the execution process (See Figure No. 2).

Figure No. 2 SmartPlant
• AutoCAD Software
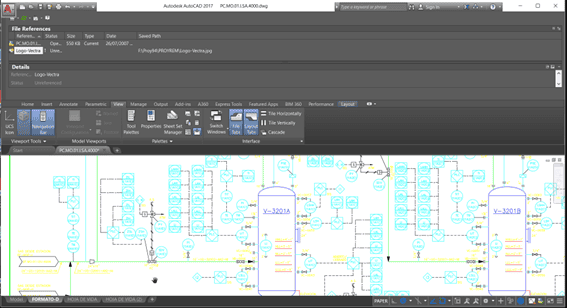
There is a library of ISA Instrumentation Symbols for AutoCAD Software based on the symbology of the ISA standard, ANSI / ISA 5.1-2009, Instrumentation Symbols and Identification.
It is graphic symbol software developed for the Autodesk AutoCAD software platform (See Figure No. 3). It contains graphic symbols to be used during engineering design for a variety of instrumentation-related activities. The following can be drawn on it: process flow diagrams (PFDs), piping and instrumentation diagrams (P&IDs), loops, logic diagram development, electrical schematic designs, and functional block diagrams.
The specifications of each component of the diagram are loaded into the application, information that is then incorporated into a data manager, from which downloadable reports can be obtained for other database applications and to generate planning and construction documents.

Figure No. 3 AutoCAD
• Microsoft Visio Software
There is an ISA instrumentation symbol library for Microsoft Visio Software based on the ISA standard, ANSI/ISA-5.1-2009, Instrumentation Symbols and Identification.
It is graphic symbol software developed for the Microsoft Visio software platform (See Figure No. 4). It provides graphical symbols to be used during engineering design and drawing layout for a variety of instrumentation related activities including: Process Flow Diagrams (PFDs), Piping and Instrument Diagrams (P&IDs), Loop Diagrams , logic diagram development, electrical schematic designs, and Functional Block Diagrams.

Figure No. 4 Microsoft Visio
For more information:


 WhatsApp